
Walk Mode
Walk mode is a feature in PHDwin used to drag the cursor along the production on a graph and view exact coordinates points. While in walk mode, the coordinates are held in place and the cursor is the only thing that changes to a diamond shape. Walk mode is not used to make any changes to projections, rather to view data points and how projections relate to historical data. This makes it easy to record and analyze certain historical or projected values at a given date.
Once you enter Walk Mode by clicking on Walk, the Projection ribbon displays the following information:
- Actual versus Projected production rates if both are displayed on the graph at a given time
- The projected decline rate at any point in time instead of just the initial on the Projection ribbon
- The current x-axis coordinate point (Walk Date) and the Production Precedence (Historical or Projected)
- Cumulative and Remaining values at the specified date
In addition, you can use walk mode to:
- Break your decline curve projection into two segments by walking to a certain point on the projection and cutting it in half.
- Truncate the end of the projection by walking to a certain date and deleting the projection from that point on.
For example, you could use walk mode when dealing with a bubble point. Because the GOR changes at the bubble point, you might want different segments to represent the different GORs. So, you could enter walk mode and “Walk up” to the bubble point, then create a new segment that begins at that point to represent the change in GOR.
Using Walk Mode
To enter walk mode and move the walk date
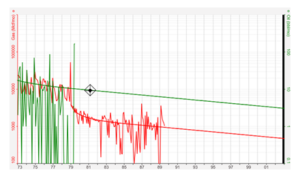
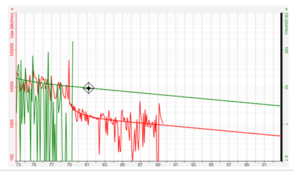
- Open a graph, go to the Projection Ribbon and click on Walk Mode 🟦. Walk – a small diamond-shaped target 🔷 pops up at the Report Date on the projection line. In Walk Mode, the Projection ribbon changes to a Walk ribbon. Changing cases while in walk mode automatically exits walk mode.
- Change the walk date by:
- Dragging the diamond shaped target left or right along the history/projection
- Typing a date and time in the Walk Date input box or clicking the arrows next to that box – this moves the walk diamond a step in one direction or the other. A step is typically one month using the up and down arrow on the keyboard.
To change the product:
- Use the product drop-down menu located next to the “product” label on the Projection Ribbon. This switches the product you’re viewing.
- Alternatively, in walk mode, click and drag the diamond (a draggable marker or cursor on the graph) directly onto a different product’s historical or projection line to switch to it.
To change precedence:
If both the historical and projected data overlap each other at a given time, let PHDwin know which line the diamond should follow. To do this:
- Set the precedence to either History or Projection in the Volumes section of the Walk Ribbon when walk mode is on.
- If precedence is set to History, the diamond follows the historical production line.
- If precedence is set to Projection, the diamond follows the projection curve.
What are the values shown on the toolbar?
While in walk mode, the data on the Walk Ribbon is updated in real-time to reflect the Walk Date — which is exactly where the diamond icon is located on the graph.
- Q Act (Historical): This shows the actual historical flow rate (in the units listed next to the product name on the graph). This rate is populated based on actual production in that month and is therefore based on real (not standard)time.
- Only populated if the date has historical production associated with it. For scheduled production dates, this rate is the same for the entire month.
- Q Prj (Projected): The projected flow rate — this is the rate associated with the user-defined projection (in the units listed next to the product name on the graph). This field reports 0.00 if no projection exists for that walk date.
- Q Prj – Decline rate at the listed Walk Date: The decline rate only changes if the user walks a curve that is hyperbolic, or if they walk from one projection segment to another.
- Cum at Walk Date – Cumulative value produced up until the walk date for the selected product.
- Tech Rem – Remaining volume from the Walk Date to the end of projection (this does not take into account the economic limit; it continues until technical EUR). The technical remaining is calculated by subtracting the Cumulative from the Technical EUR.
- Tech EUR – All historical production plus projected data (it does not take the economic limit into account).
How to Add a Segment to the Projection Using Walk Mode
You can use walk mode to split the projection into two segments at a certain point in time (or at a certain rate or after a certain volume has been produced). To do so:
-
- Open a graph.
- Go to the Projection Ribbon.
- Click on the Walk button (the one with the diamond icon).
- The program will display the Walk Ribbon and a small diamond-shaped target will appear on the projection line.
- Change the Walk Date (move the diamond):
- Drag the diamond-shaped target left or right along the historical or projection line.
- Type a specific date directly into the Walk Date input box, or
- Click the arrows next to the Walk Date box to move the diamond one step at a time.
- Split a Projection Segment (while in Walk Mode):
- Make sure the Projections Window is open.
- Click on the Split button (the scissors icon).
- This will split the projection into two segments at the chosen date (where the diamond / walk cursor is currently located).
- Alternatively, when the desired truncation date is reached, double-click on the walk cursor. This also splits the segment in two and exits Walk Mode.
This function is not supported for Scheduled Projection Segments.
Walk Mode Calculations
The rates and volumes displayed in walk mode are calculated based on the projection type. See
these additional topics for more information: