
Running Reports
Reports are the final step after the Decline Curve Analysis and is a culmination of all the work done in PHDwin. Reports show the economics and/or production data based on projections, economic inputs, and case settings. A report can be run from within PHDwin to see the output from one or more of the cases created. There are several default report formats that users can choose from. Users can also create custom report tables to view the exact values needed in an SQL table. The reports begin at the report start date specified in the scenario settings.
To Run a Report from the Reports Ribbon
A report can be run directly from the Reports Ribbon. Users can choose to run a report for a single case or a for a group of cases at a time. To run reports for several cases at a time, make sure to
sort the cases on the Case List for the cases to be reported in the preferred order. The sort orders control not only the order of reports, but also the order of summary report pages. For example, to
generate a summary report for each reserve class and category, set that up in the sort order before running the report.
To Run a Report:
-
Go to the Reports Ribbon.
-
Choose the type of Report.
Some common options are:
- Standard Eco – A 15-year landscape report with gross and net oil volumes, revenue, taxes, expenses, investments, discounted, and undiscounted cash flow.
- Detailed – A 15-year portrait report with more columns broken out compared to Standard Eco. It also provides options for different views that support different levels of detail, such as the gross and net volumes for any 3 specified products.
- Combo – A one-line report with the ability to drill down and see the Standard Eco and Detailed formats.
- One Liner – This one-line report actually has multiple formats to switch between after the run, similar to the Detailed report.
- Eco Excel Export – a report that is similar to Standard Eco but formatted to export directly and
cleanly to Excel.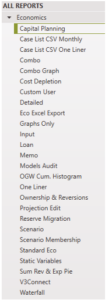
The following drop-down menu is a list of the available reports. If any of these reports do not meet your specific needs, click on Add a New Report… to add a custom report.
-
Click on the icon next to the report template name if you’d like to adjust the number of years to output and the number of years monthly. Only certain reports such as the Eco Excel report display the monthly values on the initial run. Some others, like Standard Eco, allow users to zoom in on monthly values by clicking on the Year within the report.
-
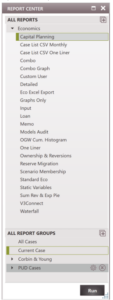
Select the cases to run the report on by picking the Report Group. The available options are:
- All Cases – Runs a report for all the cases in the case list.
- Current Case – Only runs a report for the active case.
- Selected Cases – Runs a report for all the highlighted cases in the case list.
- Any Report Groups that a user has created.
Note: When only the current case is selected, there are differences between the “Current Case” and “Selected Cases” options:
- “Current Case” includes unsaved changes (uncommitted data) in the report run, whereas “Selected Cases” only includes data that has been committed to the database.
- “Current Case” never invokes summaries, while “Selected Cases” always invokes summaries, even if only one case is selected.
- “Current Case” should re-run and refresh when the current case changes, but “Selected Cases” never automatically re-runs.
-
Select the Summarization:
- Cases and Summaries – Generates a report for each case, in addition to summaries set up in the sort order.
- Cases only – This option generates a report for each case, no summaries.
- Summaries only – No individual case report is generated, only the summaries set up in the sort order.
- Grand total only – Prints a grand total page – summaries or individual case reports are not generated.
-
Select the Destination – Choose to send the report directly to the default printer that is set up on the machine, a Preview Window, open as a PDF, Data only, or directly to Excel. The default is Preview. This allows users to review the report before optionally saving, exporting, or printing it.
-
Configure the additional settings:
- Revenue – Displayed in standard, thousands (M), or millions (MM) of the selected currency units.
- Units – Set the unit convention for the products. This can be either Imperial or SI units.
- Currency – Set the currency for the products. Several options are available, including US dollars ($), British pound (£), Euros (€), etc.
-
Click on the Run button to generate the report.
To Run a Report from the Report Center
While it is possible to run reports from the report center, the main function of the report center is to
create report groups.
The recommended way to run reports so that all settings are available is to use the reports ribbon as discussed above.
1.Go to the Forms Flyout and double-click on the Report Center.
2.Select the report type to run by double-clicking on the name.
3.Select the report group by double-clicking on the name.
4.Go to the reports ribbon to adjust any additional settings – including where to send the report.
5.Click Run.
Report Preview Window: Exporting, Saving, and Printing Reports
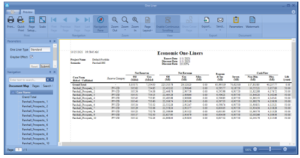
When the Preview is selected as the Destination, the window below pops up so that the report could be viewed before it goes directly to the printer or another output destination:
Navigating & Searching
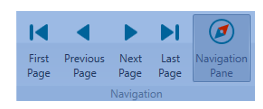
In the Navigation section, there are arrows to help navigate through the report pages. Click on the Navigation Pane button to open up more options.
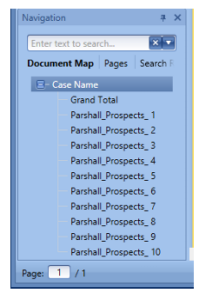
In the Navigation Pane, there are three tabs available:
- Document Map – this shows all the cases that have been run in this report and makes it easy to move through the pages of the report or jump to a specific case.
- Pages – this tab shows preview of the pages in the report and allows easy selection of which page to display .
- Search Results – this tab is used to view search results after searching the entire document for a certain word or value in the report.
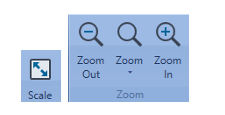
Scale
Click on the Scale button in the Print section to set a zoom level or specify how many pages to fit the document to. You can also use the zoom icons in the Zoom section to zoom in or out of the document.
Page Setup & Watermark-
Adjust the size, page orientation, and/or margin of the report.
– Add a watermark image or text to one or more pages of the report
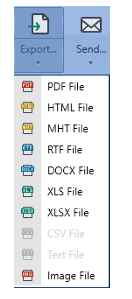
Exporting & Printing
Click the arrow under the Export Icon in the Export Tab and select which format to use for exporting the report. A new window opens up to select the location to save the report to. Other options are available depending on the export format selected.
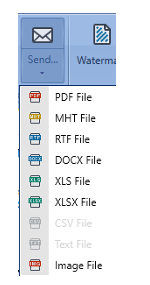
Click the arrow under the Send Icon in the Export Tab and choose which format to use in sending the report in an email. A new window opens up to select the location to save the report to. Other options are available depending on the export format selected.
– Send the report to the printer – displays a prompt to select a printer.

– Quick Print – send the report directly to the default printer set up on the computer with NO prompt to adjust settings.
