Monthly Production
The Monthly Production form is used to view the historical production volumes for all available products – including cumulative values and calculated ratios. The available products will correspond with the active Phase Configuration for the active case, so you must add products to the Phase Configuration settings to be able to add monthly data for them. You can copy and paste monthly production data from Excel directly into this form to simplify importing data.
Where Can I View or Edit the Historical Monthly Production for a Case?
Click on the Forms flyout and then double-click on Monthly Production.
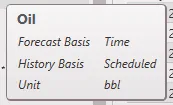
In the Products List fly-out on the left, select the products to view in the table using the check boxes. The product units are displayed in the header of each column. The volumes for any products that are set up with “Scheduled” history can be directly adjusted in this table. Hovering over a product’s name displays some of its properties, including what is set for the “History Basis”.
To display the values of the future production of any product which has been forecast on the graph, check the “Display Forecast” box. This will add the future monthly volumes to the table (note: you cannot edit forecast values on this form; they are view-only).

Jump to Specific Date
To view a specific date on the form:
- Enter the date in the Search Dates – this can be input as yyyy or mm/yyyy
- To jump to the beginning or end of historical production, click on the Date range at the top of the form (producing years). This shows years that are populated with historical data for any product (including calculated products)
- Use mouse to scroll through the grid to view more data.
Product Start and End Dates
•Each product can have different start and end dates for historical production. This means one product can have volumes for January – August 2014, but another product may only have values filled in until February 2014.
Reported Volumes – History takes Precedence by Default
By default, when there is an overlap between historical and future production, historical data takes precedence when presenting volumes on reports, graphs, etc. PHDwin uses the historical volume to calculate values such as EUR. To change these settings, go to the Projection Ribbon > Phase Configuration > Precedence.

Editing Values on the Form
There are several ways to add historical data to PHDwin. One of the simplest ways is through Importing data from a known data file source or an excel file. Users can choose to add data directly in this form, entering data row by row, or by copying and pasting from Excel. You cannot overwrite cumulative values, projected values, or products defined as a formula. Projected values can only be changed while forecasting.
To edit any value
- Double-click in the cell next to the month that needs to be adjusted. Enter the volume for the product in the units displayed at the top of the column.
- Use the tab key to go to the next cell to the right in edit mode.
- Hit Enter to go to the cell below the current one.
- Use the arrows on the keyboard to move around the cells in the form and double-click to edit another month.
NOTE: formula based products will be skipped over when using the keyboard to move about the form.
To Adjust Pre-cumulative Values
PHDwin allows for a pre-cumulative value to be entered to account for values that were produced prior to the first month of entered historical data. To adjust the pre-cumulative values, enter values in the top row that says “Pre“.
NOTE: Only the very first year of “Available Production” can have a pre-cumulative value entered.
To Change the Order of the Columns
Click and drag product header in between two columns to place columns in the desired positions. The products must already be checked in the Monthly Production Form to allow them to be moved around.
To Delete Values
Highlight the entire range of rows/columns and hit the Delete button on the keyboard. Undo delete by clicking Cancel in the Quick Access Toolbar. But this change cannot be undone if the change has been saved.
Copying and Pasting Data from Excel into the Monthly Production Form
To Copy/Paste Data from Excel
- Create or open the Excel spreadsheet containing the dates and volumes for any products to add. The product units should be the same as it is in PHDwin.
- Rearrange the columns in the spreadsheet and/or PHDwin so that the products are in the same order in both programs.
- Highlight all volumes (do not highlight dates or product names/column headers) in Excel. Right-click and click Copy or press Ctrl + C to copy the data to the clipboard.
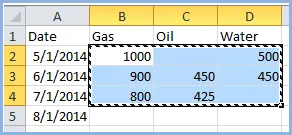
Note: When creating the Excel Sheet, the dates must be contiguous, meaning the rows cannot skip any months. If there is no production during certain months, either input zeros for those months or leave them blank.
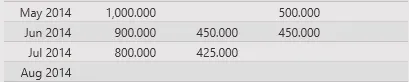
4.In PHDwin, jump to the correct date (month and year) to paste the data. This should correspond to the first month in your spreadsheet.
5.Right-click on that first month, and click Paste or press Ctrl + V. The volumes will be pasted downwards and to the right if multiple columns were selected. There should be no gaps in the monthly data; rows that do not have data will be filled in with zeroes. Any columns containing products that are formula based will be skipped.
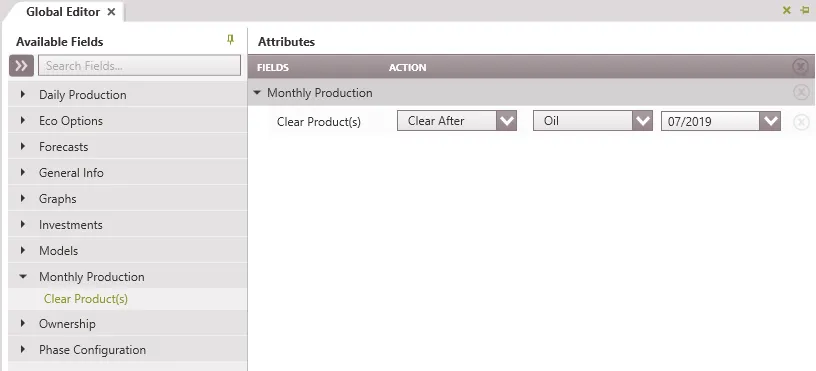
Globally Editing Monthly History
The Global editor can be used to clear all values before or after a certain date for one or all products using the “Clear Products” field under Monthly Production. To do this:
- Open the global editor form
- Drag all the cases to clear data
- On the available fields, select Monthly Production. Drag the “Clear Product(s) field into the attributes area.
- Select the appropriate action (Clear All, Clear Before, Clear After) and select the product(s).
- If Clear Before or After is selected, provide a reference Date.
- Click Apply. This action clears the selected product.