
Navigating the Program & Interface
Ribbons
Following Microsoft standards, PHDwin utilizes Ribbons at the top of the program for navigation. The Ribbons are organized into tabs by the data they present and are your primary mode of navigation throughout the GUI. Ribbons present different capabilities for importing and creating new cases, editing cases and forms being displayed, forecasting inputs, altering settings, and producing reports, etc. There are five ribbons that correspond to the functions that users are able to utilize. To increase available workspace, you can right-click on the ribbon and select “Minimize the Ribbon”. All ribbon options will still be available when you click on the ribbon tab label and will automatically collapse when you click outside of the ribbon. You can restore the ribbon to be persistent by right-clicking any of the ribbon tab labels and selecting “Minimize the Ribbon” again.
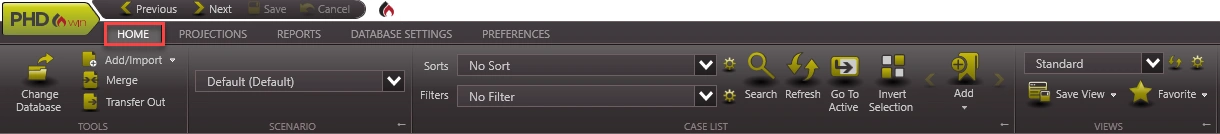
Home
The Home Ribbon is used to manage the case list and interface configuration preferences. The user may bring in new data, transfer database out of the instance, toggle between scenarios, sort and filter cases in the case list, and customize their display. The user may also switch to a new database and/or instance from the Home Ribbon.
Projection
The Projection Ribbon is one of the ways for altering the projection data used in evaluations. The user may toggle between the products they are projecting, edit the parameters of each of the projection types and segments, view cumulative, technical remaining and technical EUR for the selected product, determine appropriate curve fit and manipulate the curves and display information on the graphs. Users can save, apply, and manage graph models as well as set the appropriate Phase configuration for the case.

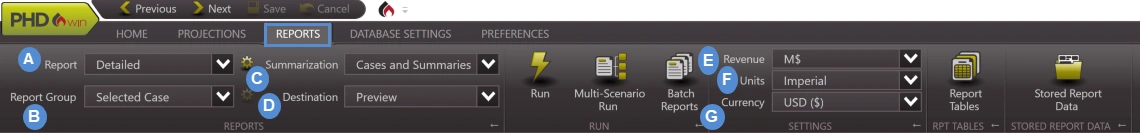
Reports
The Reports Ribbon is where users can select which cases to include in a report and the report type they would like for their particular need. The program contains various reports with different output catered to different client needs. Report settings like the unit convention or currency to use throughout the report can be modified here. Users also have the ability to add new or edit existing report tables to be used with standard and custom reports. Previous stored report runs can also be accessed here.
Database Settings
The Database Settings Ribbon was designed with the IT professional or Database Administrator in mind. Changes of corporate settings impact all scenarios in the current database and could impact economic results. The corporate settings can be edited when in “Edit Mode”, which is enabled when a user clicks Edit in any of the corporate items listed (Currency, ID Codes, Streams, etc.). Edit Mode is a “Single-User Mode”. In a multi-user environment, entering Edit Mode kicks out all other users currently working on the database. Such users will lose any unsaved changes to their work. Hence, it is recommended to notify colleagues before attempting to enter Edit Mode. Preferences.
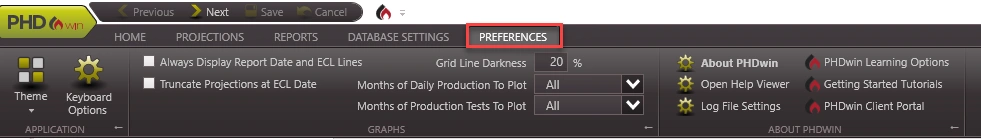
Preferences
The Preferences Ribbon is where users can modify settings unique to their individual needs. This includes application settings such as @keyboard shortcuts and program @themes , help file viewer, PHDwin online resources, and graph display settings.
When the Projection ribbon is in focus, regardless of which options are checked, the Report Date and ECL Lines, and the full forecast for the active case are always shown. When any other ribbon is in focus, the display adjusts based on the following:
·If “Always display Report Date and ECL Lines” option is checked, then the Report Date and ECL Lines display on all graphs at all times, regardless of the form or ribbon that is in focus.
·If “Always display Report Date and ECL Lines” option is not checked, then the Report Date and ECL Lines are hidden when the Projection ribbon is not focus.
·If “Truncate Projections at ECL Date” option is checked, then the portion of the projection after the ECL date is hidden on the graph, making it look like the projection ends at the ECL date.
·If “Truncate Projections at ECL Date” option is not checked, then the full projection is displayed at all times, regardless of the form or ribbon that is in focus.
These same rules affect the way graphs are printed when included in reports or using the Print options on the Projection ribbon. The graph print matches the display of the graph when the Projection ribbon is NOT in focus. Other Considerations
Grid Line Darkness: Controls the opacity or how dark the grid lines are. It ranges from 0% for no grid lines to 100% for very dark grid lines.
The Truncate Projections at ECL setting affects the graph when displaying multiple scenarios/qualifiers, as well as related cases as follows:
Qualifiers/Scenarios
·If “Truncate Projections at ECL Date” option is not checked, then the full projection for all selected scenarios and qualifiers are displayed at all times, regardless of the form or ribbon that is in focus.
·If “Truncate Projections at ECL Date” option is checked, then the portion of the projection after the ECL date is hidden on the graph, making it look like the projection ends at the ECL date.
oScenarios should honor their respective ECL dates to best compare the economic projections at all times.
oQualifiers within the current scenario should show the full projection when the projection ribbon
is active and truncate when the projection ribbon is not active.
Related Cases
·Only the projection for the current case in the current scenario will honor the Truncate Projections at ECL setting.
·All projections from related cases, whether incremental or recompletion, should truncate the projections to their own respective ECL dates at all times. Behavior does not change when the Truncate Projections at ECL option is checked or unchecked.
·If a related case is non-economic, the projection is truncated to it’s own economic start date.
Custom Views
When a user opens PHDwin for the first time, what is visible is a blank workspace. However, when @data is imported , it is then possible to arrange all needed forms and graphs, and save it as a custom workspace or view. There are default Views that are included with the program that users can use for projects or use as references in developing custom views. Users can set up these custom Views and save those to support routine tasks.
Custom Views are handy and could be set up and saved to:
·customize the interface as you’d like to see it.
·save time in finding the needed inputs.
·organize windows differently for specific tasks.
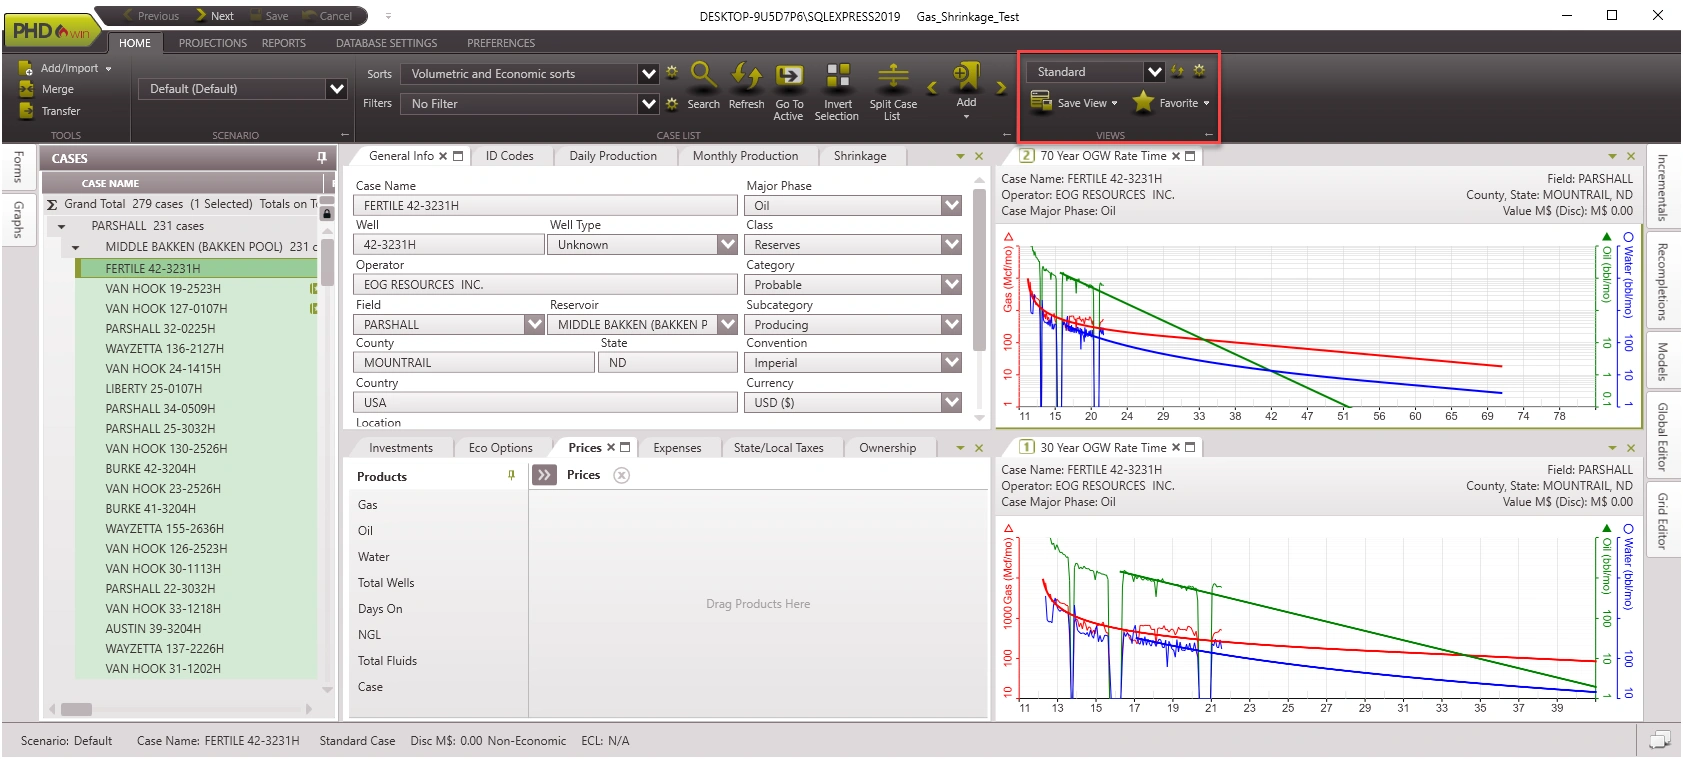
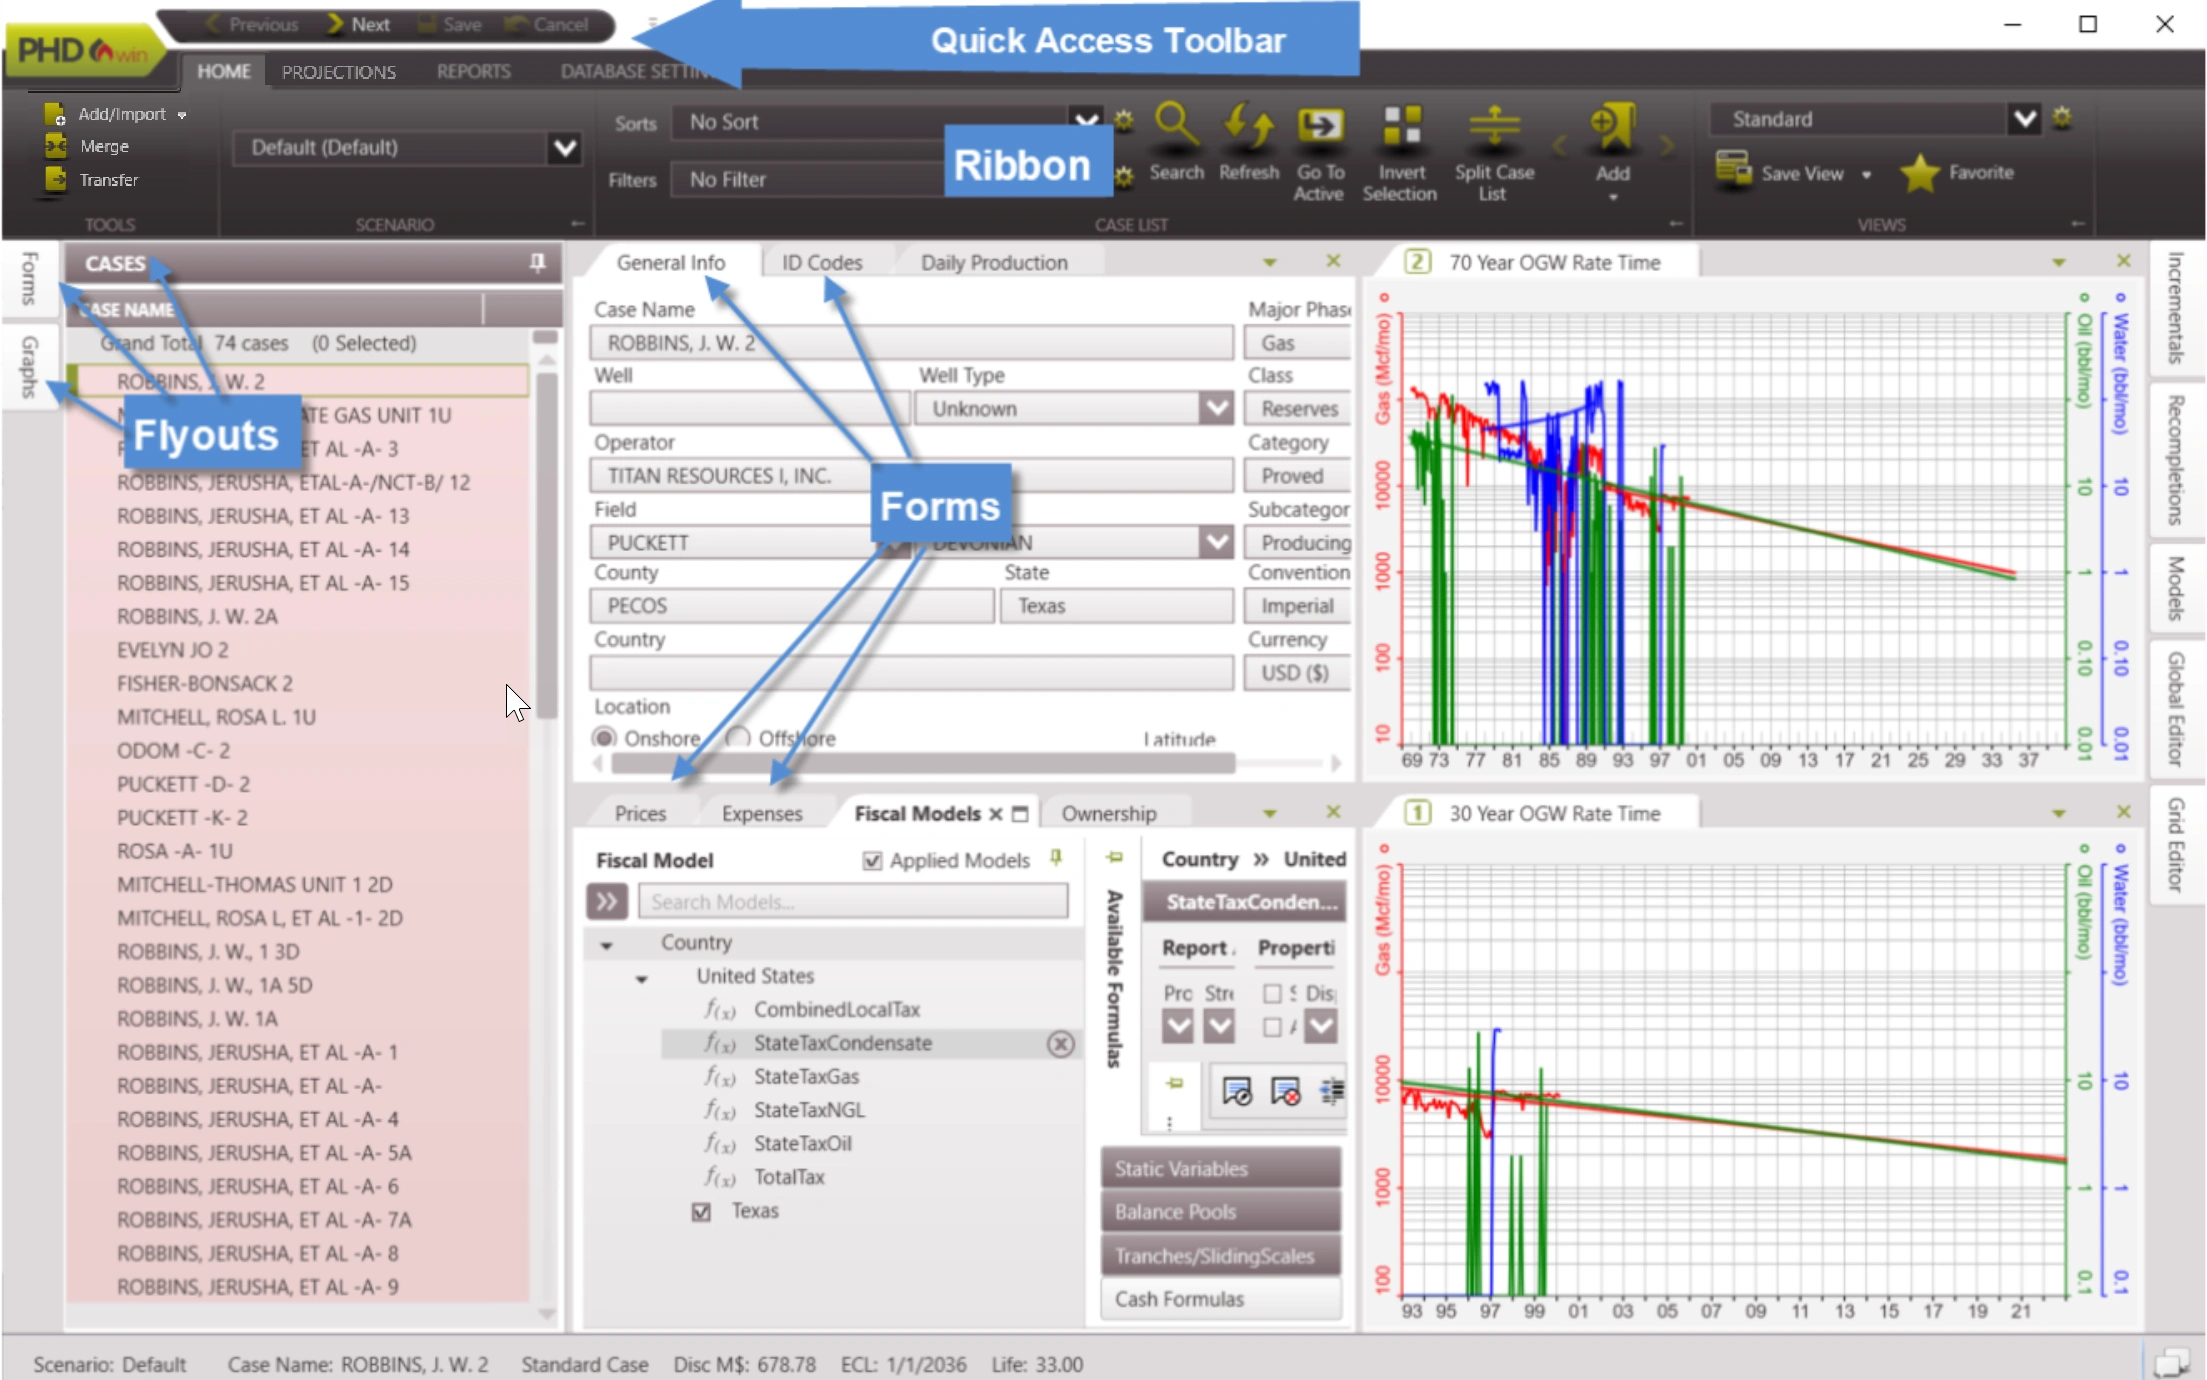
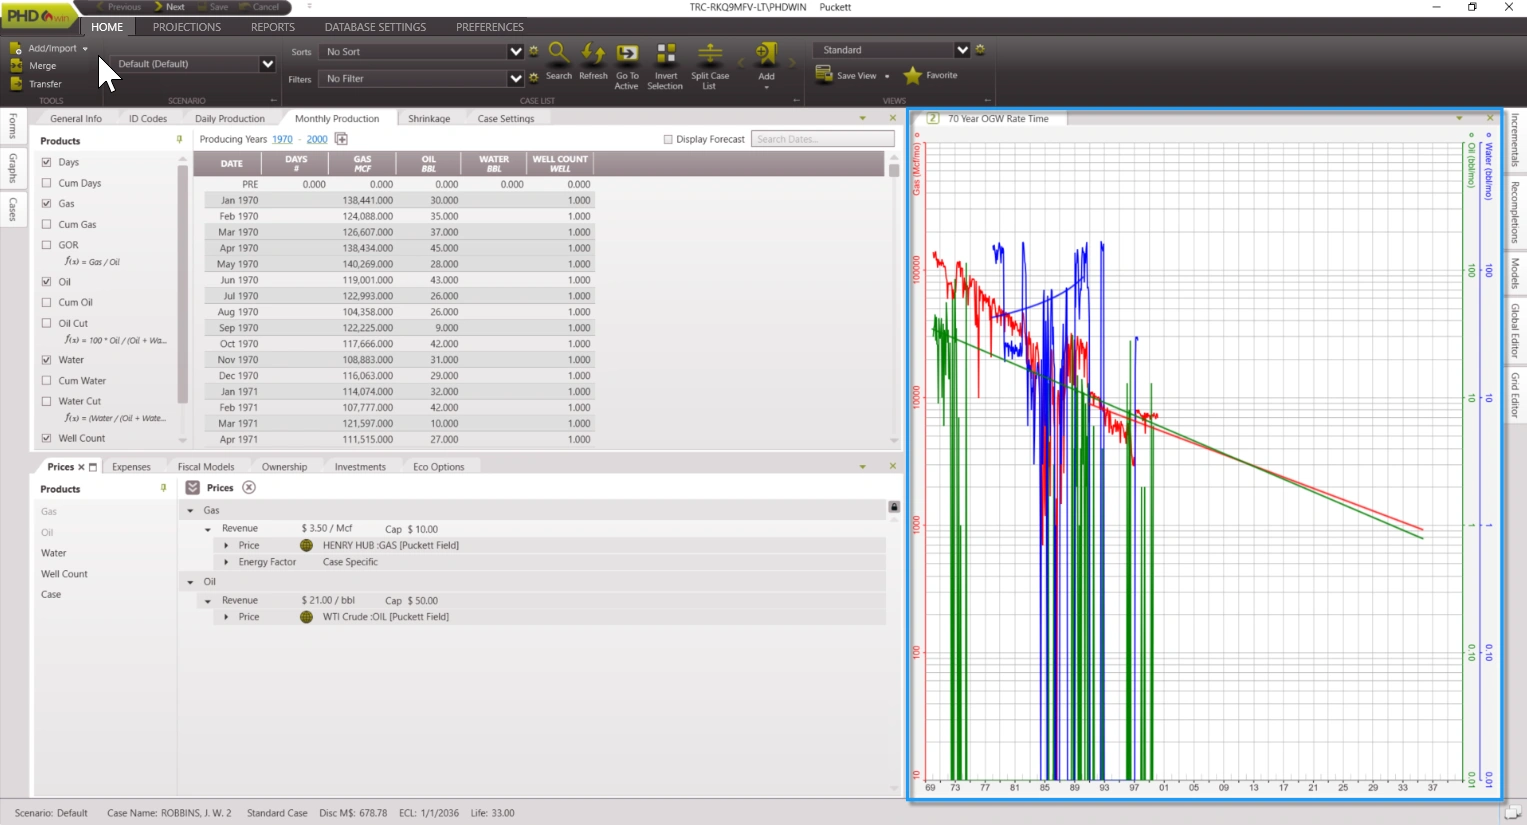
You can save multiple views, and even create a ‘favorite’ view that you use most often by clicking on the drop-down menu next to favorite and selecting set Favorite to make the current view the favorite view. The favorite view can be accessed with a quick shortcut button . In addition, views can be created as ‘private’ such that other users won’t have to see them on their list. The image below is the Standard View. The projection graphs are on the right side and the Case Information is on the left.
The color of the interface can be changed by adjusting the @Theme .
Items in the PHDwin Interface
·Ribbon – The ribbon is the gray section at the top of the PHDwin that has several tabs. While the ribbon cannot be customized, it can be minimized by right-clicking on it and selecting “Minimize the Ribbon”. The ribbon provides a quick access to tools like adding cases, managing sorts and filters, editing scenarios, setting views, changing graph settings or even running reports.
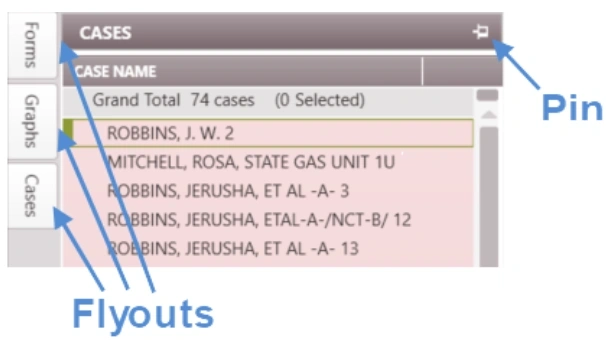
·Flyouts PHDwin has flyouts on the left and right corners of the GUI. On the left-hand side, the flyouts are Cases, Forms, and Graphs. The Cases flyout shows all cases or wells in the project in the case list. The Forms and Graphs flyouts have a list of windows that can be added to the current view by double-clicking on them. On the right-hand side, the flyouts are Incrementals, Recompletions, Models, Global Editor, and Grid Editor.
·Forms and graphs Forms are windows used to input data on each case. For example, there are forms to enter prices, expenses, ownership, etc. The graphs are like a form but used for visualization. Graphs are used to view the historical or future production profile for each well. It is also used to plot the revenue or cash flow for the case.
·Quick Access toolbar – The quick access toolbar is located above the ribbon. It could also be moved below the ribbon. It makes it easy to Navigate through cases by clicking “previous” or next”. It contains the save and cancel buttons to save or cancel changes made to a particular case. More buttons can be @added from the ribbon to this toolbar if desired, for easy access to any functionality.
Arranging Forms on the Workspace/View
Forms need to be added to the view before they can be arranged to get the desired view.
To add a new form to the workspace
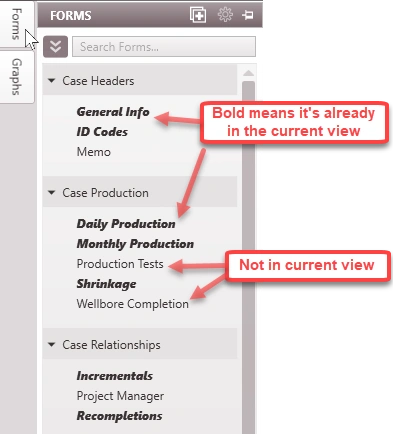
1.Click on the Forms flyout (on left-hand side of the screen) to see a list of all forms available. If a form is already displayed in the view, its name will be in bold. The Forms flyout can be pinned in place by clicking on the symbol in the upper right.
2.Double-click on the name of the form to add it to the view OR drag and drop it to place it at a desired location on the workspace.
·If this is the first form added to the view this one form will fill up the entire workspace.
· If one or more forms are already displayed the form become a tab on top of the tab group closest to the upper left.
Arranging forms with the directional placement tool
Once the form has been added to the view,drag it around to arrange it in the desired location on the view. The following examples show how to:
·Split the screen into different sections to see multiple forms at once.
·Create tabbed groups of forms to quickly flip to other forms without having to open and close them.
·Move the forms to be free-floating to place them on different monitors.
Example 1 – Splitting the Screen into Multiple Sections:
To view multiple forms at once, split the screen into different sections. To do so:
1.Click on the name of a form and drag it until you see the Directional Placement Tool.
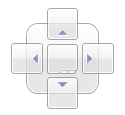
2.Move the form around and notice that the arrows on the tool are highlighted, along with the area where the form will be placed when the mouse is released.
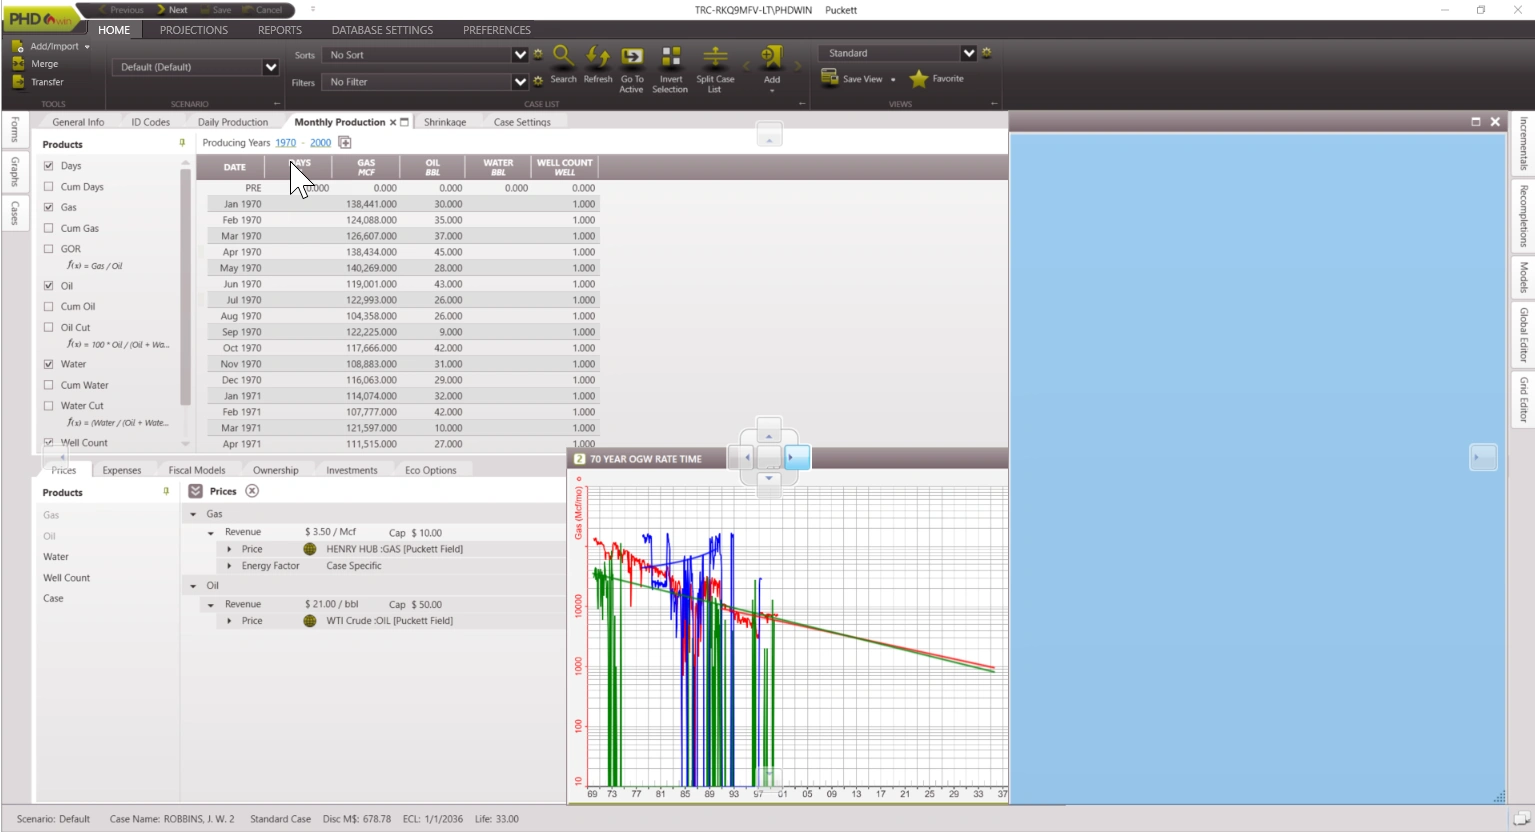
3.Once the proper section is highlighted, drop it in place. This results in a new pane so that another form is visible:
Example 2 – Creating a Tabbed Group:
You can have multiple forms tabbed behind each other so that you can quickly flip back and forth between the forms you need to use. To do so:
1.Click on the name of a form and drag it until you see the Directional Placement tool:
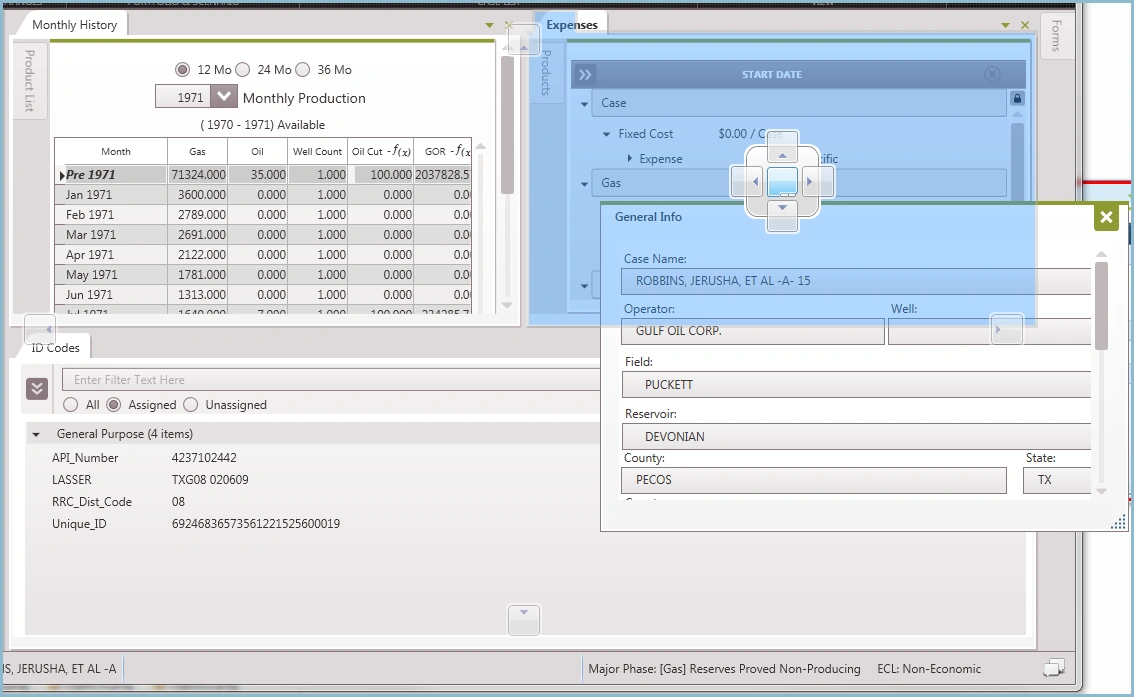
2.Move the form around and notice that the arrows on the tool are highlighted, along with the area where the form will be placed when the mouse is released. Ensure the middle of the tool is highlighted, so that it looks like the form is being dropped on top of another form. In the example below, the General Info tab needs to be placed in the same tab group as the Expenses form.
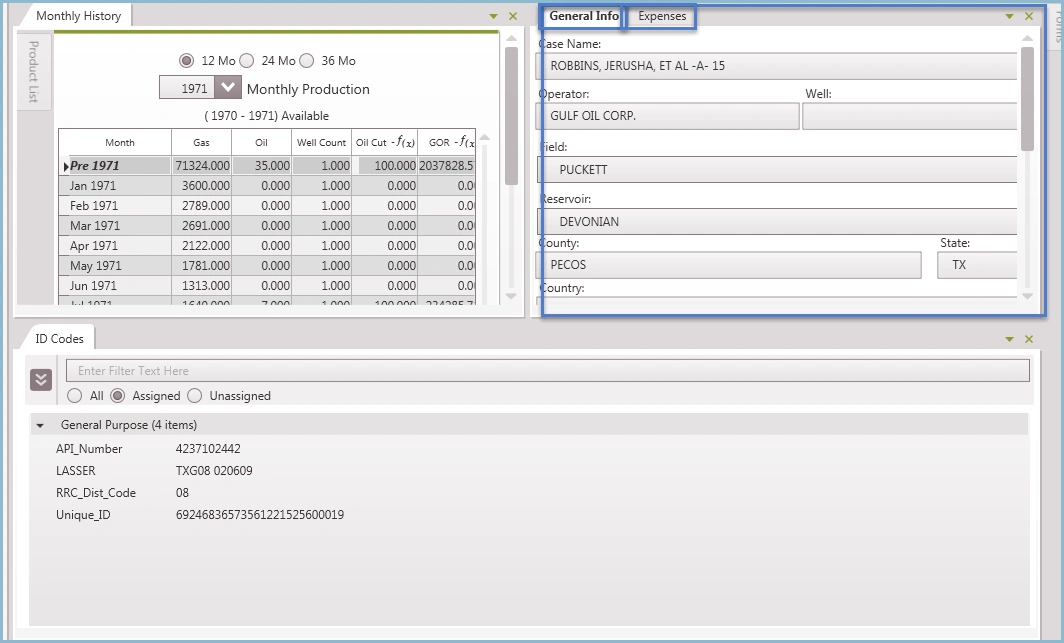
3.Let go of the mouse and drop the form on top of the one behind it (the expense form). This results in a new tabbed group. Notice that the General Info form is now in the same tab group as the Expenses form.
Example 3 – Pulling Forms onto Other Monitors:
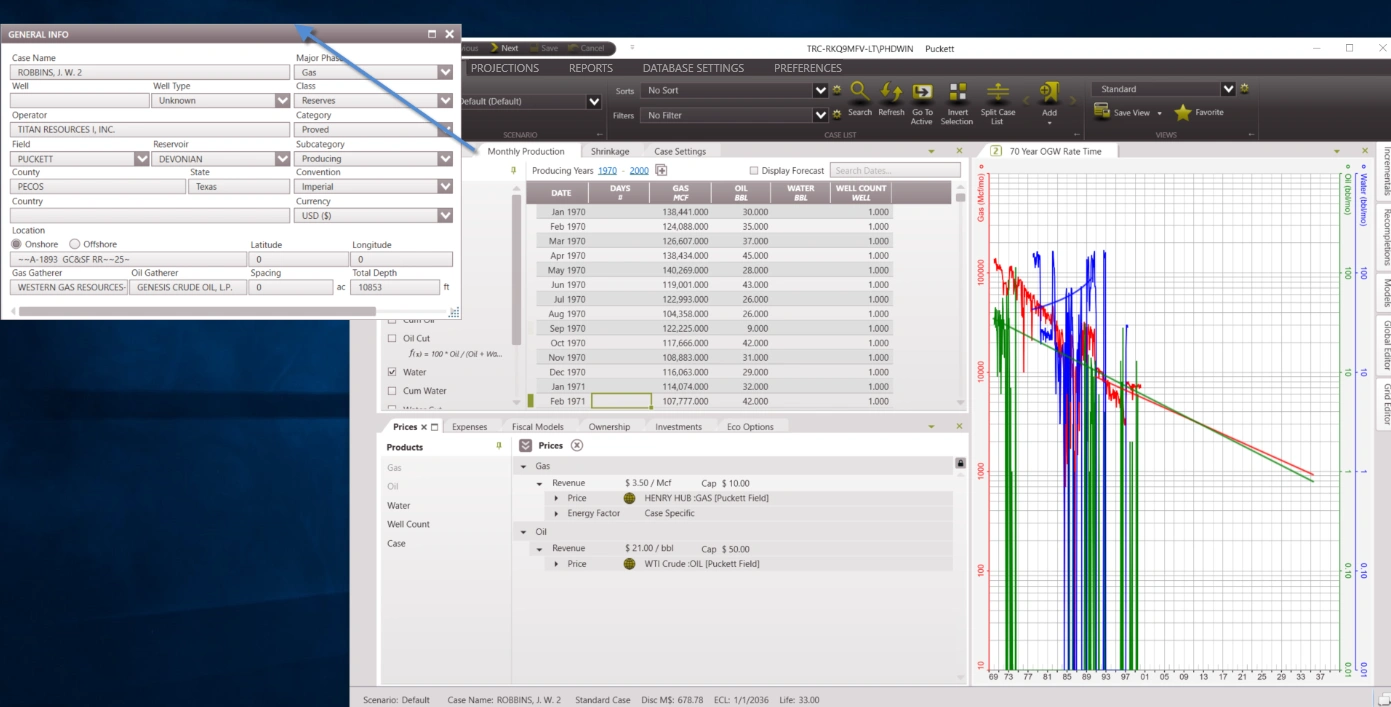
Make sure a form is free-floating to drag it onto a completely different monitor. To drag a form to a different monitor, click on the name of the form and drag it completely off the PHDwin desktop. This results in a free-floating window on the same or an adjacent monitor. The free-floating form can be dragged to a new screen and maximized to fit the new screen.
Using and Creating Flyouts
By default, three flyouts (Forms, Cases, and Graphs) are on the left-hand side of the program. Hover the mouse over the form or click on the name of the flyout in order for it to temporarily “fly” out onto the screen. The form disappears once the mouse is clicked on any other location on the program. Flyouts can be pinned to the screen in order to make it a component of the workspace or they can be re-arranged to the top, right or bottom of the screen as described below.
To Pin a Flyout or Lock It in Place
1.Click on the for flyout of interest.
2.Click on the pin icon on the top right of the flyout to pin it in place.
To Move the Flyouts to the Top, Bottom, or Right of the Screen To customize a view of the database and choose the position of the flyouts:
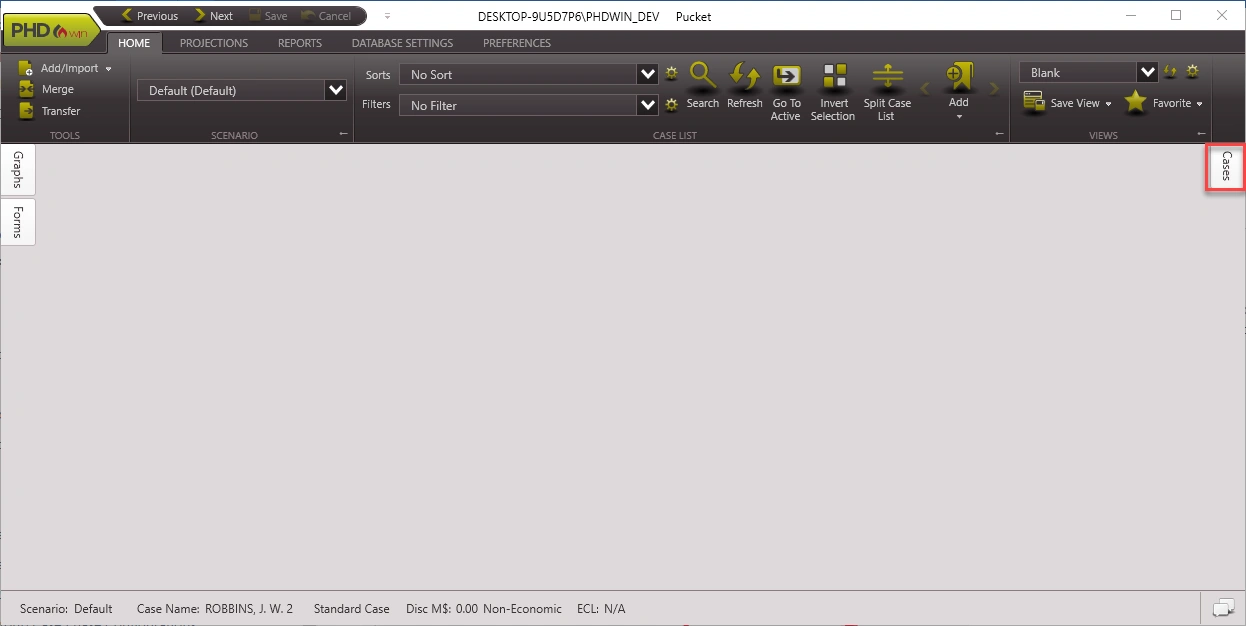
1.The easiest way to do this is to start with a blank view, which can be selected by clicking on the Home Ribbon > View Section, change the View drop-down to Blank.
2.Click on the flyout and click on the pin button to lock it in place.
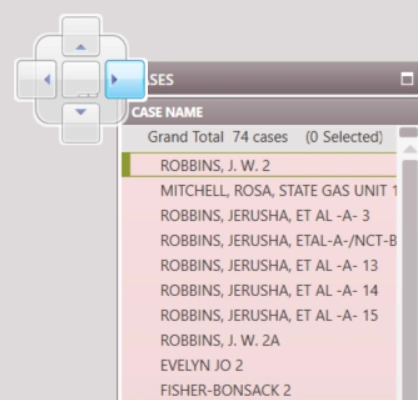
3.Hold down on the name of the flyout (right next to the pin) and drag it to the top, right or bottom of the interface. This will be done using the directional placement tool – the arrow that is highlighted will be where the flyout would land.
For example, to move the flyout to the right side of the screen, drag and drop the flyout so that the right arrow turns blue as below:
4. Now, when the flyout is unpinned, it will be hidden/docked on the right side of the screen as shown below:
Saving Your Views
Once all the forms have been arranged, they can be saved as a View to be able to re-use it. You can quickly switch between saved views from the drop-down menu on the Home ribbon.

To Save a New View
1.Go to the Home Ribbon>View Section.
2.Click on the drop-down next to Save View button and select Save View As.
3.Type in the name of the view.
4.Select Apply. The saved view should appear in the drop-down Views menu from now on. To Overwrite an Existing View
1.Go to the Home Ribbon>View Section.
2.Switch to the view you want to overwrite.
3.Rearrange forms as needed.
4.Click on the Save View button to overwrite the current view – do not click Save As. Use the Save
As option to create a brand new view.
Exporting and Importing Views
Once a view has been saved, it can be exported and imported across other databases. This is particularly useful when a user creates custom views to perform certain tasks and would like to use these views to perform similar tasks in different databases.
To Export a Saved View
1. Go to the Home Ribbon>View Section.
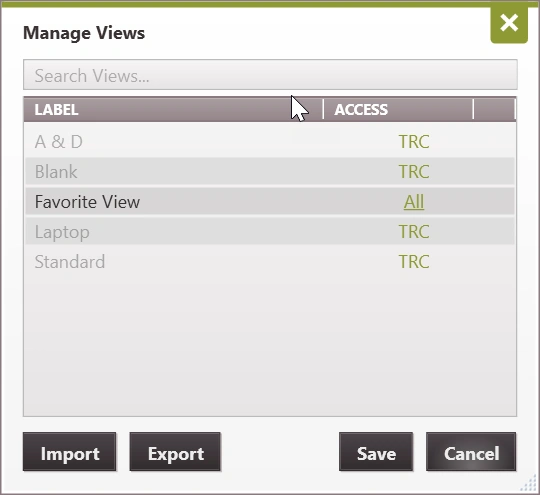
2. Click on the gear button beside the view drop-down to open the Manage Views dialog.
3. Select the view and click the Export button. To export multiple view, hold down Ctrl and select as many views to export . To export all custom views, just click export without selecting any view.
4. Select file path to save the file and click Save.
To Import a View
1. Go to the Home Ribbon>View Section.
2. Click on the gear button beside the view drop-down to open the Manage Views dialog.
3. Click the Import button.
4. Search and select the file containing the saved view.
5. Select the access level and click Save.
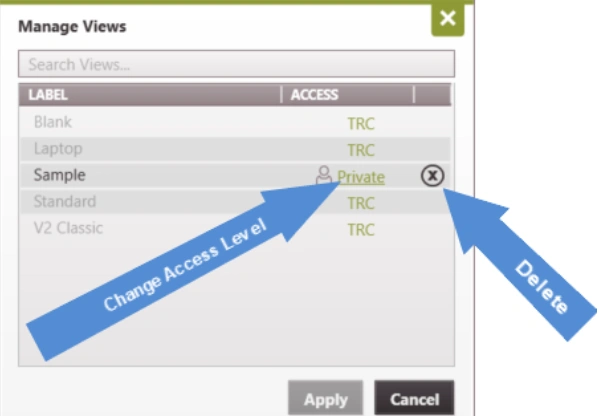
Managing and Deleting Views
The View manager can be used to:
·Rename a view
·Change the access level (if others can access or edit the view)
·Delete a view
·Export and import a view as discussed above
To open the view manager:
1.Go to the Home Ribbon>View Section
2.Click on the gear button beside the view drop-down to open the Manage Views dialog:
·To rename – double-click on the name of any View and type in the new name.
·To change the Access level – Click beneath ACCESS to select from:
oPublic – All users will be able to utilize the view, but only the person who created it will have access to edit or delete it.
oPrivate – Only the user who created the view will be able to see, use, make edits to, or delete the information. No other users will be able to see the item when using PHDwin. If you are creating a view for just yourself, this would be an appropriate setting.
oAll – All users can see, edit, use or delete this view.
·Click on the to delete a view. Note that the TRC views cannot be deleted – they are used for support purposes.
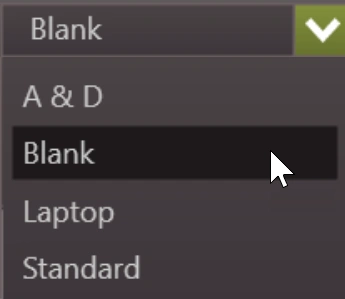
Changing the Current View
To switch views:
1.Go to the Home Ribbon>View Section.
2.Use the drop-down menu that says “View” to switch between views:
Setting a Favorite View
If you have a view that is used frequently, you can set it as the favorite view so it can be called up quickly.

To Set the Favorite View
1.Go to the Home Ribbon>Views Section.
2.On the home ribbon, use the drop-down menu to select the View that you want to be the favorite.
3.Click on the arrow below favorite and choose Set as Favorite. This places the star icon next to it in the list of views.
To Select the Favorite View
Click on the star icon that is labeled Favorite. This sets the favorite view as the current view.