Graph Titles
Each graph in PHDwin can be adjusted to fit the user’s needs for forecasting or presentation purposes. The steps below show how to customize the graph settings for a rate-time or rate-cum graph.
Graph Titles
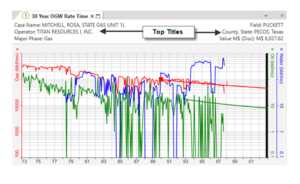
Graph titles are used to display information about the case on the graph. For example, graph titles can be set up titles to show case specific information such as the EURs, and the NPV of the case, which are updated automatically as changes are made to the case.
To display and choose titles
1.Open the desired graph to adjust its titles.
2.Go to the Projection Ribbon and click on Show Titles in the Tools tab to display them on the graph.
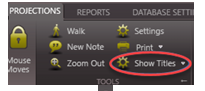
3.Click on down arrow next to Show Titles and click Edit Titles to choose the desired titles to display.
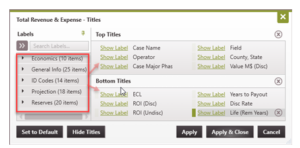
3. Drag and drop any item from the Labels to the proper spot in the Top or Bottom Titles. The order mimics how they will be displayed on the graph, three on the top left, three on the top right, same thing for the bottom of the graph.
4. Click to toggle between Show Label or No Label. The title label is displayed in front of each value on the graph, to make it easy to see what values are being referred to. For example the title label for the Operator is “Operator” and the value is “Titan Resources I, Inc.”. However, titles like Case Name might not need a label, but if displaying a value it can be helpful to know what that value represents.