
Graph Models and Templates
Graph Models can be used to standardize the settings and appearance of graphs on
your cases in PHDwin. After creating a graph model, it is easy to copy its settings to
other graphs, or link other graphs to the model so that as changes are made to the
model, the presentation of the graph will automatically update as well for all cases
linked to it.
How Do I Create a Graph Model?
To create a new graph model:
1.Click on the button on the top right-hand of the Graphs flyout.
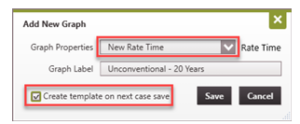
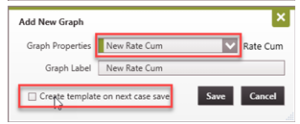
2.In the Graph Properties drop-down menu, select either New Rate Time or New Rate Cum.
3.You would not be able to create a new model/template if an existing model is copied and
renamed.
4.Enter a descriptive Label for the new template under Graph Label.
5.Check the box that says Create template on next case save. This option is not available if you copy from an existing template. Also make sure to save only after setting up graph products and properties.
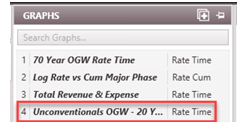
6.Click Save to save the new model. The model is now listed as one of the graph templates. Double-click on it to activate it and add it (or drag and drop it) to a graph tab. Do not save the case yet until the model set up is completed.
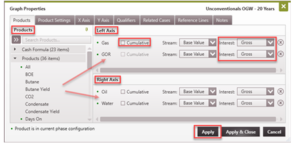
7.By default, Oil and Gas are added as products on the graph. Double-click on the graph to open the Graph Properties window. In this window, add the desired products by dragging it from the list of Products on the left and place it either on the Left Axis or Right Axis panes.
8.Set the product as Cumulative and the Interest as Gross, WI, Net, ORRI, or ECL (depending on the interest type you want to visualize). Click Apply to effect these changes and update the product list on the Product Settings tab.
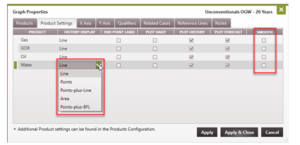
9.Go to the Product Settings tab. Edit the set up as desired. Use the drop-down menu to display historical as a Line, Points, Points-plus-Line, etc.
10.Go to the X Axis tab to set its properties. Here, set the Format as Linear or Log. If Log, select how many Log Cycles to display or set as variable for PHDwin to make that determination automatically. The Horizontal Axis parameter set could be useful to model flow regime or just to display the temporal component of the data. The options available are:
- Time – use to display as Date (example 1/1/2021, 2021, 21, etc.)
- Δ Days – use to display using number of days from Major Phase Start of Production (SOP).
- Δ Days² – use to display using the square of the number of days from Major Phase Start of Production (SOP).
- Δ√Days – use to display using the square root of the number of days from Major Phase Start of Production (SOP).
- Mat. Bal. Time – use to display using the Material Balance Time.
- Depending on the option set for Horizontal Axis, the X Axis Minimum can have several options for setting the minimum value for the Horizontal axis. If multiple options are selected, the minimum value is used as the X Axis Minimum. The options for the minimum are:
- Fixed Date – specify the four-digit year greater than 1799. PHDwin assumes 1/1/yyyy.
- Economic Start – Link to the case eco start date.
- Major SOP – Link to the first date of production of the case’s Major Phase.
- Report Date – Link to the Report Date set for the Scenario.
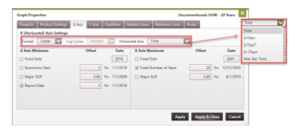
- Offset – For some options checked, an offset can be specified. The actual X Axis Minimum is the selected date less the offset. For example, setting the date as the Report Date (which is 1/1/2021) with an offset of 5 years sets the X Axis Minimum as 1/1/2016 (see image below).
- There are no options available when the Format is Log. If Linear option is selected for Format, the X Axis Maximum can have several options for setting the maximum value for the horizontal axis. If multiple options are selected, the maximum value is used as the X Axis Maximum. The options for the maximum are:
- Fixed Date – specify the four-digit year greater than 1799. PHDwin assumes 1/1/yyyy.
- Fixed Number of Years – enter the number of years the entire length that the horizontal axis extends.
- Major EUR – Link to the date the production reaches the EUR of the case’s Major Phase.
- Offset – For some options checked, an offset can be specified. The actual X Axis Maximum is the selected date plus the offset. In the image below, a 20-year model is being set up. The Fixed Number of Years offset of 20 years means the total length of the X axis is 20 years beginning from 1/1/2016 to 12/31/2035.
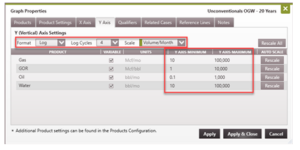
- Next, go to the Y Axis tab to modify the settings for the vertical axis. The options available are:
- Format – specify whether to use a Linear or Log scale to plot the data
- Log Cycles – Select the number of log cycles when Log Format is selected
- Scale – Specify the unit of measurement as Volume/Month or Volume/Day
- Y Axis Minimum/Maximum – Use the drop-down menu to set the range for the Y axis.
- Rescale – Use this to automatically set the scale using the range of the data for the current case. Since this process is for setting up a model that will be applied across many cases, set a scale for each product that will be more representative for all cases.
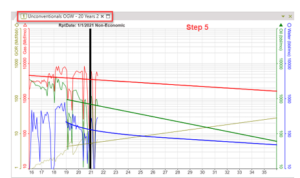
14. Add Notes to remember what this model is for. This is recommended. However, a good title could suffice. The model being set up here has been named “Unconventional OGW – 20 Years”.
This suggests that the model has been prepared for an unconventional case and will display 20 years of data on the horizontal axis.
![]()
15.Click Apply & Close
16.Click Save to Save the current case and add the Graph model as a template. Once this is done, the Graph Model becomes available to apply on other cases.
How Do I Apply the Model Properties to Another Graph?
There are two ways to do this in PHDwin – through the Graphs flyout and through the Models section in the Projection ribbon.
To apply a Graph Model through the Graphs flyout:
- Click on the Case of interest.
- Click on the Graph flyout and click the 📋 button on the top right-hand of the Graphs flyout.
- In the Graph Properties drop-down menu, look for the created model (or any other model) and select it.
- Click Save. This adds the graph model to the list of graphs in the Graph flyout.
- Double-click on the added graph to see the plot for the current case. This is a good starting plot. Modify the look on the current case if desired by double-clicking on the graph and making the appropriate change to the graph settings.
To apply a Graph Model through the Models section in the Projection ribbon:
- Click on the Case of interest and select the graph to apply the model to.
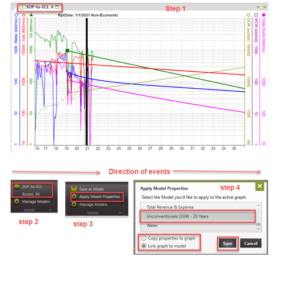
- If the selected graph has any model currently applied to it, that model is replaced. In the example below, the graph in slot 1 is selected and it currently has a model called SOP-to-ECL applied to it. Click on SOP-to-ECL, Access All. This breaks the link from previous model.
- After step 2, the image in step 3 is displayed. This is the image that should be displayed if not model is applied or graph is empty. Click on Apply Model Properties to open the window in step 4.
- Select the model from the list of available models. Choose Copy properties to graph (graph name remains unchanged) or Link graph to model (graph name changes to model name).
- In step 5 we see the results when Link graph to model is selected. The graph properties as well as the name change to those of the applied model.
- Open that graph.
- Go to the Projection Ribbon, on the Model section and then click the unlink icon 🖇️ on the left of the graph model name. This unlinks the model and brings its properties local (case-specific).
How to Apply a Graph Model to Many Cases?
The global edit is used for multi-case editing. Hence, it is useful for applying graph settings across multiple cases at once. In the current version of PHDwin V3 (as discussed under Global Edit), users are able to:
- Copy Model Properties – This global edit allows users to copy the graph properties of one graph (Graph 1) to another graph (Graph 2) for each case. This is not the same as applying a graph model, because it only changes the properties of Graph 2 for the selected cases. Hence, after the edit, if the properties of Graph 1 change, the properties of Graph 2 does not automatically change too.
- Link Model – When this global edit is applied, any changes to the model properties of Graph 1 will be reflected on other graphs that are linked to it. Users can also choose to remove the link (by selecting “Bring Local”). Doing this means the user would no longer see Graph 2 properties changed whenever Graph 1 properties are modified.
To edit graphs for more than one case using Copy Model Properties:
- In the global editor, select the cases to apply the new graph settings/model. Drag and drop the cases to the Cases pane.
- In the Available Fields, open up Graphs (by Label or by Number), drag and drop the Copy Model Properties function into the Attributes pane.
- Select Apply, then select the source Graph, and select the Destination Graph (this could be a Label or Number depending on the Available Fields selected).
- Click Apply to apply the changes to the cases. The title of the graphs does not change, but the graph settings are updated to reflect the edit made.
To edit graphs for more than one case using Link Model:
- In the global editor, select the cases to apply the new graph settings/model. Drag and drop the cases to the Cases pane.
- In the Available Fields, open up Graphs (by Label or by Number), drag and drop the Link Model function into the Attributes pane.
- Select Apply, then select the source Graph, and select the Destination Graph (this could be a Label or Number depending on the Available Fields selected).
- Click Apply to apply the changes to the cases. The title of the graphs may not change, but the graph settings are updated to reflect the edit made.
Models can only be brought local (make it case-specific) after being applied to the cases. To bring a model local, repeat the process for Link Model. Instead of Apply in step 3, select Bring Local. Make sure to select the same model that has been already applied. If this is not the case, the selected model will not be applied as expected.
How to Delete a Model from Graph Model List?
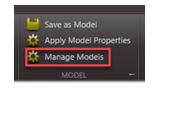
- Go to the Projection Ribbon, on the Model section and then click the icon next to Manage Models.
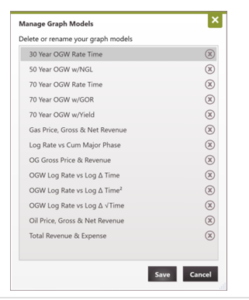
- In the window that opens, hover over the name of the graph model and click on the 🗑️ button to delete it.
What is Stored in Graph Models?
The following graph properties/settings are stored to a graph model. They are also locked down and cannot be edited while the model is linked to any graph.
- Titles – displayed on the top of the graph
- Format – Linear or Log for x and y-axis
- Number of Log Cycles – if applicable, for each axis
- Scale – Volume/Month or Volume/Day
- Minimum and Maximum dates or rates on the X-axis – rules applied to find the start and end point for the x-axis
- Visible Products – which products are displayed on the graph & their placement (left or right)
- Product End Point Label – the option to add a label (of the product name & scenario) on the graph
- Daily Volumes – option to plot Daily Volumes for products
- Forecast – the option to display the forecast/projection
- Smooth – the option to apply a smoothing factor to the selected product.
- History – the option to display the history for a product
- History Display – if the historical data for the product is plotted as a line, points, etc.
- Units – if they are variable or fixed
These settings are not
- Graph Notes – all notes/annotations are graph specific
- Projection qualifiers displayed on the graph. However, the active projection qualifier is always displayed.
To change any of the options listed above before creating a model, see Graph Properties.