
Models
A model is a stored input record that exists independently of any cases in your database, but can be referenced/applied to any case within the database. Models are built to apply the same economic inputs, including price deck, expenses, and shrinkage, to multiple cases. When a case is linked to a model, any changes made to that model will automatically be updated for that case. Models help ensure consistency for parameters like pricing to make sure it remains the same for a certain group of cases. The models form is used to create models in PHDwin. It is simple to create models for an entity like a strip price by copying and pasting the values from an excel spreadsheet right into the models form.
Note: This section focuses on creating and editing models using the models form in PHDwin. There are other ways to create models in V3. You can import a V2 Models file directly into a V3 database. For details, see Importing a PHDwin Models File. You can also import/export models via a csv file. See Model Import and Model Audit report for more details
To View Models
Click on the Forms Flyout and then double-click on Models to add it to the current view.
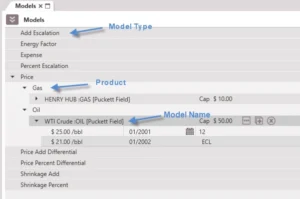
As shown in the above image, you can create models for the following categories:
•Energy Factor – Available for gas products only. The energy factor is the amount per unit volume of gas that can be burned off. The higher the energy factor, the more efficient. The energy factor can change over time so you can add several segments to account for changes in the energy factor over time. The energy factor changes the BTU factor, which converts a volume of gas (mcf) to BTU.
•Expense – An expense is a recurring monthly cost. PHDwin recognizes five standard expense categories (fixed, well, operating, other, transportation), and users have the ability to create other categories. Classifying these expenses is important for correctly applying expenses to cases. Each expense is unit-based; it is multiplied by a given unit to calculate the applied cost.
•Add Escalation – Add Escalation Models allow the user to increase prices or expenses by a dollar amount over time. Users can add segments and specify the time period that the escalation would be applicable. PHDwin offers two escalation types: fixed and continuous. A fixed escalation will behave in a stair-step manner, while a continuous will be a straight line.
•Percent Escalation – Percent Escalation Models allow the user to increase prices or expenses by a percentage over time. Percent escalations work similarly to add escalations. These percent increases will either be fixed or continuous over the specified period of time.
•Price – Price refers to the amount of money paid for the sale of a commodity. Price Models make the job of updating pricing simple. By setting up a price model and linking cases to that model, the user only has one price to maintain. Differentials and BTU factors may be used to adjust individual cases as needed. All commodity prices are unit based. The revenue for each product for any period is calculated by multiplying the product’s volume by its adjusted commodity price.
•Price Add Differential – The Price Add Differential Model is used to add or subtract a certain dollar amount per unit volume to the price model for the specified time periods. For example, for gas the units would be $/Mcf
•Price Percent Differential – The Price Percent Differential is used to add or subtract a percent for a specified time period. The Price Percent Differential is a one time price change for its designated time segment. Users can choose to add several different segments for the price percent differential value to change over time.
•Shrinkage Add – Shrinkage will be applied in a fixed volume format. The amount entered will be the amount shrunk. Shrinkage is applied on gross reserves and then netted down by the revenue interest. Shrinkage can be case specific or set up as a model.
•Shrinkage Percent – Shrinkage will be applied in a percent format. The amount entered will be the amount shrunk. Shrinkage is applied on gross reserves and then netted down by the revenue interest. Shrinkage can be case specific or set up as a model.
Shrinkage is an adjustment applied to the gross volume of a product to account for the total volume of the product that did not make it to the market. Oil product could shrink due to changes in pressure, temperature, and fluid properties at the separator(s), leading to the release of dissolved gas. Gas could shrink for the same reason (leading to NGL extraction); it could be used on location to run the compressor or for electricity. Some of the gas could be flared for various reasons. As a result, only a certain fraction of the produced gas makes it to market. Hence we use shrinkage to go from gross volume to shrunk volume. Shrunk volume is then used to run economics.
To Add a New Model
To build a new model in the current database:
1.Hover over the name of the type of model to create (Energy Factor, Expense, Price, Shrinkage, or one of the Escalation or Differential options) and click on the ![]() on the right side to add a new model.
on the right side to add a new model.
2.Choose the product that the model is being designed for. For example, if building a gas price model, choose Gas; if building an oil op cost model, choose Oil. There are some special cases – if building an escalation model, choose “All” and use it to escalate any product’s price or expense as desired. If trying to build a Well Expense model, use Total Wells; for a Fixed Cost model, use Case.
3.Give the model a name by double-clicking and typing over the box that appears labeled “New Model”
4.Fill out the cap value for the model to enter one if a cap is needed. This only applies to prices and expenses.
5.Hover over the right side of the Model ribbon and click on the ![]() button to configure the model settings. These will be slightly different for every model. The settings include the following options:
button to configure the model settings. These will be slightly different for every model. The settings include the following options:
•For escalations –
•Fixed – check this box if the escalation should be fixed each year. A fixed escalation will apply the escalation at the beginning of the segment and then hold the value constant along the extent of the segment. If the escalation is set to run until ECL, it will repeat every 12 months until the economic limit is reached. If the box is unchecked, a continuous escalation will escalate throughout the course of the year. The escalation value or percent is divided by 12, and then multiplied by the number of months to get the escalation for that time. That escalation value or percent is applied to the base price to determine the escalated price. The escalation will follow a straight line from the base price to the escalated price at the end of the year.
•Until Major Phase Cap – only for price escalations – if this box is checked, the price that is being escalated will stop increasing when the major phase product reaches its cap price.
•For all models that are not percentages –
•Unit – Choose the volume unit for the model
•Currency – Choose the currency that the model is created in
6.Fill out the values in the first segment of the model – type in the initial value and the date it should begin. The initial date can be linked to an event on the case, like first production, or hard-coded. It is recommended to use hard-coded dates for things like pricing, that might be different for a specific time period. Models will always begin on the first of the month, so it is not necessary to choose the day.
7.Use the ![]() button on the right side of the model ribbon to add new segments to the model and fill out the values – values can be copied and pasted from excel which is explained next. If filling out the values by hand, pay attention to the number of months that each segment should continue for. Adjusting the initial date or number of months for any segment will automatically adjust the rest of the segments.
button on the right side of the model ribbon to add new segments to the model and fill out the values – values can be copied and pasted from excel which is explained next. If filling out the values by hand, pay attention to the number of months that each segment should continue for. Adjusting the initial date or number of months for any segment will automatically adjust the rest of the segments.
![]()
8.To insert segments – right click on the line to insert a segment below and click “Insert Segment.”
9.To delete segments – click on the ![]() next to the line that should be removed.
next to the line that should be removed.
![]()
To Copy and Paste Values from Excel to Build Models
If you don’t want to enter the values for the model by hand, copy and paste them from an excel spreadsheet. First, set up the spreadsheet like one of the samples below, and then copy and paste the values over, or in between, other segments.
Setting up your spreadsheet
Create a spreadsheet containing two columns, they should either be:
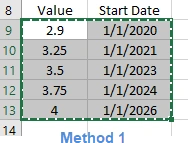
•Method 1: Value & Start Date of the segment. to use specific dates – they should be formatted as: mm/dd/yyyy (Ex. 01/01/2014) or mm/yyyy (Ex. 01/2014).
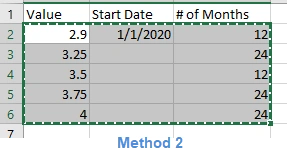
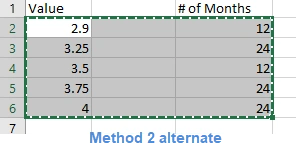
•Method 2: Value & Number of Months that the segment should last. For this method, use three columns and specify only the first row of the second column (start date) which serves as the initial date of the model. Alternatively, set the start date correctly in PHDwin and leave the second column completely empty in Excel. The second column is needed because that is the location of the Start date in PHDwin. So, for this method to work correctly, use 3 columns as explained.
After the spreadsheet is set up to look like one of the samples above, highlight the data (excluding the headers), right-click and select Copy (or use Ctrl+C).
Pasting Values from Excel over current inputs
Pasting values in the models editor was designed to mimic Excel as much as possible. In general, click on the starting row (not cell) and paste the values. The values will replace all data below it, and add rows if necessary. For example, if a user is trying to copy and paste 10 rows onto just 1 segment of pricing in PHDwin, it will add the additional 9 segments automatically.
This is what it looks like in PHDwin before pasting values from Excel; if you are using number of months (method 2 alternate), make sure the start date is set correctly – for this example, instead of Eco Start Date, set it to 1/1/2020 before pasting values. Leave everything as is for method 1 and method 2
![]()
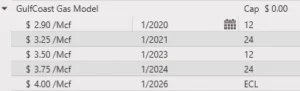
Paste into PHDwin by selecting the row where the values should begin (in this case on the $0.00/Mcf line), right-click and select Paste (or hit Ctrl+V). If there are segments above the one you are pasting into, the dates may change to resolve with the settings on the initial segment. The methods described above will result in the final model shown below.
Inserting Rows from Excel
Alternatively, insert rows above any segment by copying all the data as shown above for the paste, right-clicking on the row in PHDwin to insert the rows above, and selecting Insert Copied Rows.
To Delete a Model
Models that are in use cannot be deleted. To delete a model that is not in use, hover over the model name and hit the ![]() button. A notification is displayed to confirm this action. Select yes to finish deleting the model.
button. A notification is displayed to confirm this action. Select yes to finish deleting the model.