
Graphs
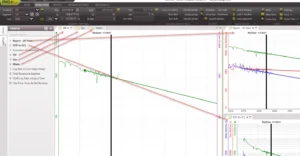
This is used to visualize production data and compare flow regimes in PHDwin. Graphs are used to plot and view the historical production data for a case and allow users to forecast the future production. It can also be
used to plot other streams like revenue, expenses, or cash flow over time. There are several forecasting methods available in PHDwin:
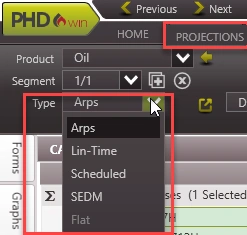
•Arps – The most commonly used production forecasting method that uses historical production data and the Arp’s equations to create projections according to the desired inputs.
•Stretched Exponential (SEDM) – This is a slight variation of the Arp’s exponential method, using the same variables but applies a different equation.
•Scheduled – Scheduled Projections can be used if projected volumes are known and need to be displayed on the graph. Scheduled Projections do not use a model to predict the future production volumes.
•Linear Time – The Linear time projection uses a simple rate equation to produce forecasted volumes.
•Flat Projection – The flat projection is used for time related products, such as days and Total Wells, and can be used for scheduling ratios for forecasted values on the graph.
To See the List of All Graphs
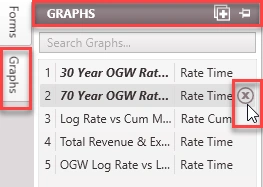
Go to the Graphs Flyout on the left-hand side of the screen. This shows a list of all of the graphs for the current case. Users can add as many graphs to one case as desired. When a new graph is added in the flyout, it is only added to the current case.
Adding and Deleting graphs
To add a new graph to one case: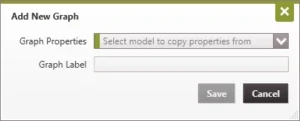
1.Click on the ![]() button on the top right-hand of the Graphs flyout.
button on the top right-hand of the Graphs flyout.
2.Choose the Graph Model that should be copied to the graph. There are several default graph templates to copy from. Users can also create custom models an it will appear on this list. The graph format (rate-time or rate-cum) will appear next to the graph name. This cannot be changed after a new graph is created.
3.Enter a Graph Label – this can be the same as the graph template name, but the list of graphs on any one case has to be unique. The number “1” will be added to the end of the graph label if the name already exists in the list of models.
4.Click Save to add the graph to the case.
To delete a graph from one case:
To delete a graph, hover over the name of the graph in the Graphs flyout and click on the ![]() button.
button.
Displaying Graphs in your View
To display a graph (or add it to the view), double-click on the name of the graph in the Graph flyout.
Graph Positions:
The list of graphs is unique to each case and users can create as many graphs as needed for each case and some cases may have more graphs than others. In addition, even if all cases had three graphs, the templates or models applied to the graphs on one case may be completely different from the next case.
When a graph is added to the view, it is added in that position in the list. The graph itself that is in a certain position in the list can be changed if the list is rearranged. Simply put, the slot in the graph list is not tied to the actual graph name. When navigating from case to case, the settings applied to that graph, or even the graph format (rate-time vs. rate-cum) can vary.
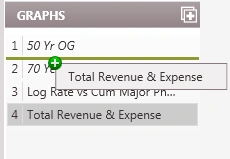
For example, here is the graph list for two cases:
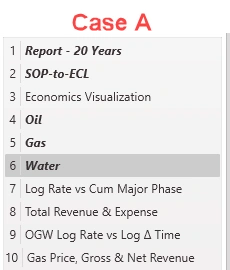

If Case A is active, and Graphs 1, 2, 4, 5, and 6 are added to the view, it should display as shown below:
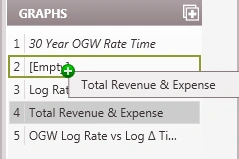
When the graphs are open in the view, the graphs are shown by position number and graph label. If the active case is switched to edit Case B, Graphs 1, 2, 4, 5, and 6 will all be presented in the view as shown below. Note that this case does not have any graph in position 6, as a result, it is undefined. Also note that the graph names and types are different between both cases.

The important thing to note here is that different cases can have different graphs in different positions. Since the sixth position in the graph list was empty on Case B, there is no graph to present in the selected view. To resolve this issue, add a new graph to that spot. The new graph can be added via the graph list or the shortcut on the undefined graph that says “Click to Add Graph”. In practice, the same graph template is applied across all cases in a database, with the graphs currently in use placed at the top of the graph list for each case.
To Rearrange the Graphs List
To rearrange the list of graphs so that the most important ones are at the top, or in the positions desired, just drag and drop them in the list of graphs to the correct position.
Grid Line Darkness
The Grid Line Darkness controls the opacity or how dark the grid lines are. It ranges from 0% for no grid lines to 100% for very dark grid lines. You can modify this setting in the preferences ribbon.
![]()