
Building Projections on the graph
The graphs can be used to create the projections for any product. Up to six products can be displayed on the graph at a time. However, in order to create a projection, the product does NOT have to be displayed on the graph. You can now modify the projection for any product that is part of the phase configuration for a case using the Projection Ribbon, even if that product is not on the graph. PHDwin supports several different projection methods that differ from one another in the equations and inputs that form the curves on the graph. When building projections, multiple projection methods may be suitable for the same graph.
PHDwin supports these projection methods:
oArps
How To Choose Which Products are Displayed on the Graph
There are multiple ways to choose which products to display on the graph. One way is to use the Projection Ribbon:
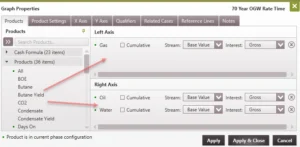
1.Open to the Graphs Properties window by double-clicking on any graph and clicking on the Products tab.
2.The list of products on the left are classified into three categories: Cash Formulas, Products, and Test Products
3.Drag and drop products from the available list to the right side of the window in order to display them on the graph. Drop the product in either the left or right axis section to choose which axis the product units will be displayed on. Each axis can have a maximum of 3 products.
4.Adjust the settings for each product displayed:
•Cumulative – Check this box to display a cumulative total for the product listed, instead of the actual value on the date displayed. NOTE – You cannot choose “cumulative” for test products – they are meant to be daily test rates not volumes and therefore should not be summed.
•Stream/Completion – Choose the stream for standard products and cash formulas or the completion for test products.
oStream – To plot the production volumes, choose Base Value. Other streams are available, such as revenue, expenses, price, etc. See the list of all streams.
oCompletion (for test products) – PHDwin allows users to store multiple zones for test data. Choose the zone to display on the graph.
•Interest – Choose the interest for the product and stream being plotted.
oGross – this is 100% or 8/8ths.
oWI – The Working Interest specified on the case.
oNet – the interest used to “net” down a certain item. For example, working interest is used to net down costs, while revenue interest is used to net down volumes and trans cost.
oORRI – The Royalty Interest specified on the case.
oECL – Will be 100% if the Working Interest is the net interest (usually the case for expenses), or the Lease NRI if the net interest is the revenue interest (used for volumes and transportation costs).
4. Hit Apply or Apply & Close.
It is also possible to add or remove products from a graph using the Projection Ribbon:
1.Go to the Segment section on the Projection Ribbon.
2.On the Product drop-down menu, select the product to add or remove from the graph.
3.Click the green arrow next to the Product drop-down menu to add ![]() or remove
or remove ![]() the product from the graph.
the product from the graph.
How To Add a Projection
1.Click on the Graphs flyout and double click-on the graph to use if it’s not already displayed in the view.
2.Click on the Projection ribbon. This is where the projection dates and rates for any product can be adjusted. You can also click on the icon on the lower right ![]() to open the projection form and use that if it’s more convenient.
to open the projection form and use that if it’s more convenient.
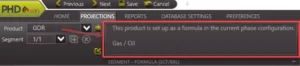
3.Use the drop-down menu next to Product to select the product to adjust – it must be available in the current phase configuration to show up on this list of products. If the product is set up to be projected, you will be able to add segments. If it is a formula-based product, such as the water cut, the formula will be listed to the right of the product drop-down. Below is an example of the GOR formula that would be displayed on the Projection ribbon.
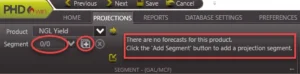
4.Look at the segment – if it says 0/0 (as shown for NGL Yield below), that means there is no projection created for that product. If there are already values there, that means the current product already has a projection.
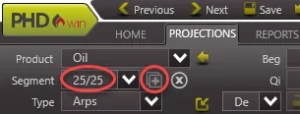
5.To add a segment – click on the ![]() button on the Projection ribbon or form and choose the projection type (Arps, Scheduled, Stretched Exponential (SEDM), Lin Time, or Flat) to add the segment to the graph. If the new segment is not the first segment added, the program will prompt you to add the new segment Before or At End of the selected/active segment.
button on the Projection ribbon or form and choose the projection type (Arps, Scheduled, Stretched Exponential (SEDM), Lin Time, or Flat) to add the segment to the graph. If the new segment is not the first segment added, the program will prompt you to add the new segment Before or At End of the selected/active segment.
•For projections, there is a limit of 25 segments. Once the number of segments reaches 25, the ![]() button will fade and the program will no longer allow addition of more segments to the graph.
button will fade and the program will no longer allow addition of more segments to the graph.
6.Edit the segment values by:
• Typing numbers directly into the Projection ribbon. To directly enter the values, simply type the proper rates or dates into the Projection ribbon or form.
oBe careful to check what the calculator button ![]() is next to. This icon indicates what the program is solving automatically for when he other values are adjusted. For example, to adjust the start date to a later date while retaining the shape of the curve, allow the program to “solve for” the end date by dragging the calculator next to End. Be aware that changing one value impacts the others, even if it is just the volume.
is next to. This icon indicates what the program is solving automatically for when he other values are adjusted. For example, to adjust the start date to a later date while retaining the shape of the curve, allow the program to “solve for” the end date by dragging the calculator next to End. Be aware that changing one value impacts the others, even if it is just the volume.
•Using the drag and drop method on the graph. See the Projection Editing Tools for tips on using the drag and drop method and other helpful tips when adjusting the projection.
7.Click Save ![]() on the top left to save the update on the case.
on the top left to save the update on the case.
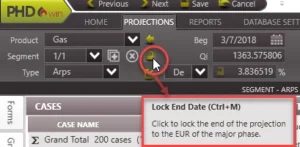
Lock to Major Phase
PHDwin allows users to lock the end date of minor products to that of the major phase projection. This ensures that all the products have the same end date. The beginning date of the first segment may be any hard date or may be linked to the case start date. To lock a product’s end date to that of the major phase:
1.Go to the Segment section of the Projection Ribbon
2.Use the Product drop-down to select the product which is to be locked to the major phase
3.Use the Segment drop-down to select the last segment for the product.
4.Click the ![]() button next to the Segment drop-down to lock/unlock the end date.
button next to the Segment drop-down to lock/unlock the end date.
Note: There is no lock option for the major phase. Only minor phases can be locked.
Other options on the Projection ribbon
•Seg Type – Lists the current segment type and allows you to change it if desired.
•Fix End Point to Product – click on the lock icon ![]() to the left of the Segment to link the end date to the same date as the major phase product.
to the left of the Segment to link the end date to the same date as the major phase product.
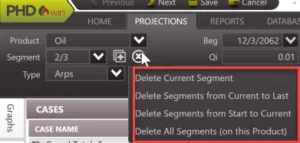
To delete a segment
Click on the ![]() button in the projection window. A window with delete options opens up: Delete Projection Segment:
button in the projection window. A window with delete options opens up: Delete Projection Segment:
•Delete Current segment – To delete the current segment only.
•Delete Segment from Current to Last – To delete the current segment through the end.
•Delete Segment from Start to Current – To delete all segments from the beginning through the current segment.
•Delete All segment (on this Product) – To delete all projection segments on the selected product only.
•Delete All segment on all Product – To delete all projection segments on all products.
An alternative way of deleting a segment is to right-click on the segment on the graph and choose Delete Segment, then select one of the above options.
Importing Projections
Projections on a case-by-case basis can be manually imported using the import window. For more information, refer to the Importing Projections page.